Methods
How do we calculate place inequality?
-
Data
Our anonymous data contains billions of visits to locations in the Boston Metro Area from October 2016 to March 2017. We analyze mobility patterns of about 150,000 anonymous users, provided through Cuebiq’s Data for Good initiative, in the whole Boston Metro area (around 3% of the population). MIT Media Lab coupled Cuebiq's anonymous location data with census information to determine user income groups and identify user visitation patterns to places. We use the census-based core-based statistical areas s to define metro areas. This definition encompasses the cities, suburbs, and commuting zones that are economically tied to a central city of interest. In the Boston case, it contains large areas in New Hampshire and down the Massachusetts coast. Finally, we have used the public Foursquare API to get the list of the 30,000 places that users visit.
-
Estimating home and income
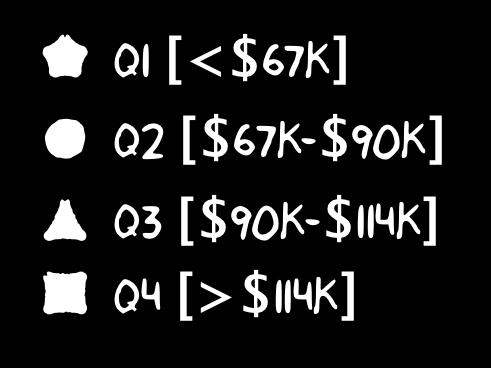
Using the same anonymous data, we determine users’ home location at the level of Census Block Groups, a statistical subarea of census tracts that each contain between 600 and 3,000 people. To determine a user's home census block group, we compute the most common block group that a user spends time in between 8:00 pm and 4:00 am. We then assign each user an income using the median household income of their "home" census block group from the 5-year American Community Survey for 2012-2016. Users were then clustered in 4 different quantile groups of annual income: low ($10,000 - $67,000), medium ($67,000 - $90,000), upper medium ($90,000 - $114,000), and high (over $114,000). Each income group contains exactly 1/4 of the users in our dataset.
-
Detecting where people visit
Using location data as described above, we determine when users stop for more than 5 minutes in a particular place. If a user stops for more than 5 minutes within 20 meters from a place, we treat them as having visited that place.
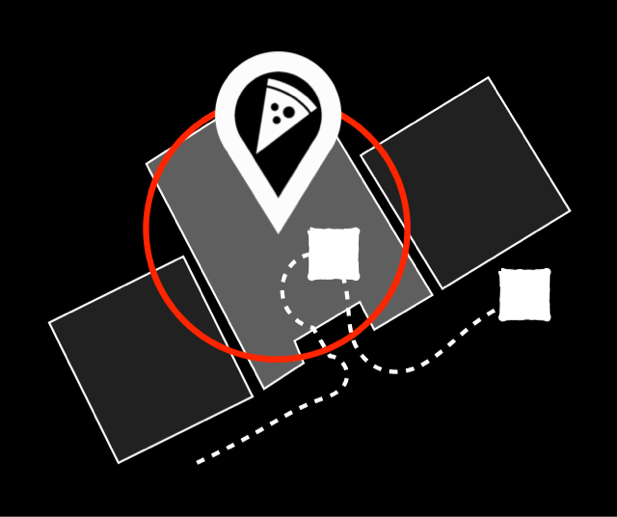
We consider a user as having visited a place if they stop within 20 meters of its location for more than 5 minutes. We consider a user as having visited a place if they stop within 20 meters of its location for more than 5 minutes
-
Measuring inequality in a place
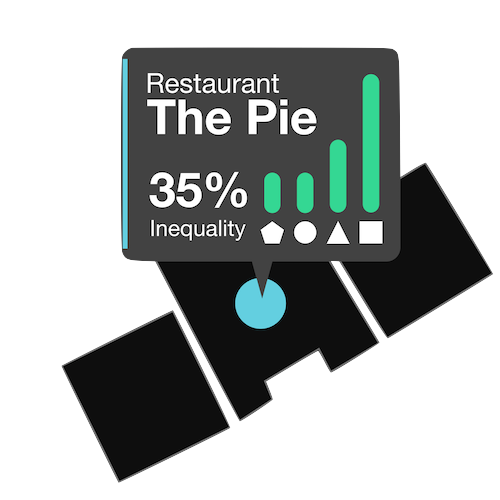
To measure inequality in a place, we first compute the total time each user spends in a venue, and then sort all users by their income group. Then, we compute the total time each income group spends in each place in our dataset. The end result is a chart for each place that shows how likely you are to see people from each income quartile if you visit.
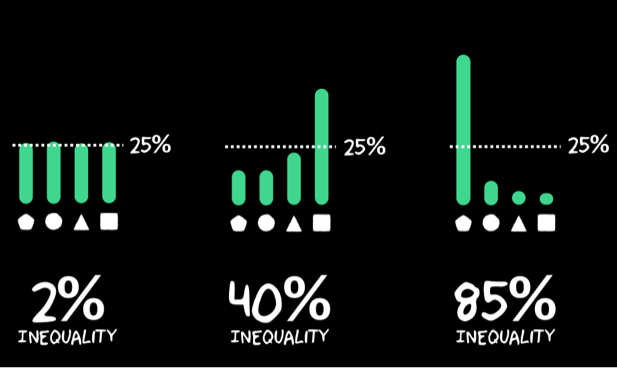
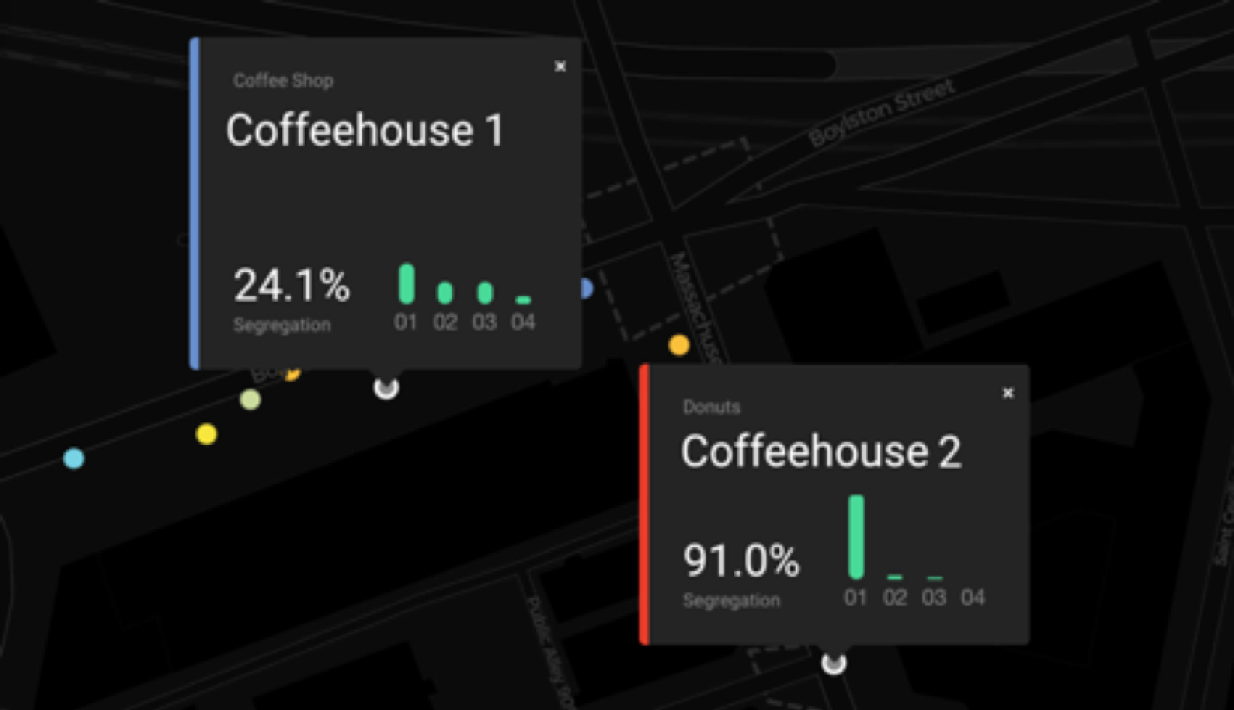
To measure the inequality of a place, we use a city-wide normalized measure. Because income groups correspond to exactly 25% of the users in the area, a totally equal place would be visited by each income group 25% of the time. This corresponds to a flat chart, like the one on the left. We consider any deviation from that flat profile to contribute to inequality. For example, a totally segregated place would show a chart more like the one on the right, with 100% of the users coming from a single income group. Mathematically, we calculate the absolute deviation of a place's income distribution from that flat ideal:
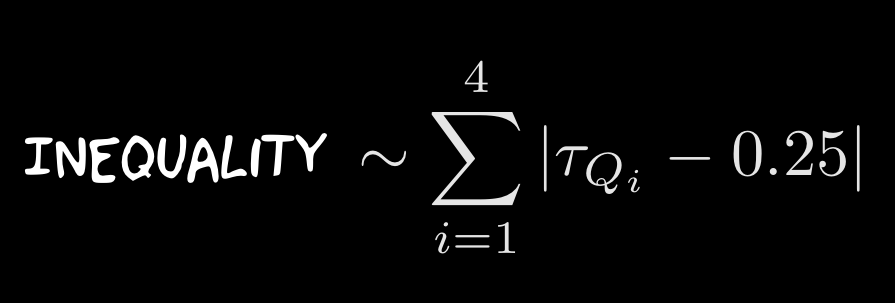
and normalize it to be between 0% (flat distribution) to 100% (only one group is present).
-
Limitations
There are several limitations with our approach that could mean our results are incomplete. First, we select users based on having consistent home locations during the 6 months of our dataset. This excludes smartphone users who are homeless, in transition, or those users who work non-normative work shifts (between 8pm and 4am). Second, the venues we consider are limited to those available via the Foursquare API. Third, our approach to determing whether a user visits a place does not account for GPS noise, and so some of our records of users visiting places could be wrong. See the FAQ for more about data representativeness.
Additionally, it is important to note that the Atlas records income inequality, not class inequality. The lowest income quantile we use encompasses a huge range of both income and socioeconomic difference, covering neighborhoods with median household incomes between $10,000 and $67,000 per year. The qualitative class differences (lifestyle, opportunity, etc) between a household with $20,000 of annual income and $60,000 of annual income are extremely large in the Boston area. Income is also known to be an imperfect proxy for class; many highly wealthy households have little annual income.

